Foot Traffic Restaurant Guide for Site Selection
Foot Traffic Restaurant Strategy for Smarter Site Selection

Foot traffic is one of the most watched signals in restaurant real estate, yet it is also one of the most misunderstood. Busy sidewalks do not automatically mean busy dining rooms. For restaurant owners, founders, operators, and site-selection analysts, the real question is whether the right people pass your door at the right times, with the right intent to buy. For more background, see Learn more about foot traffic restaurant.
A disciplined foot traffic restaurant evaluation connects pedestrian volume to concept fit, daypart demand, trade-area demographics, and unit economics. When you treat traffic as a measurable input rather than a gut feel, you improve forecasting, reduce location risk, and protect prime cost before you sign a lease.
This guide walks through practical ways to define, measure, and apply foot traffic in restaurant location strategy so your next site supports culinary yield, labor planning, and long-term brand growth.
What Foot Traffic Really Means for Restaurant Operators
In restaurant site selection, foot traffic is the count and quality of people moving through or near a prospective trade area during relevant operating hours. Quality matters as much as quantity. A corridor with heavy commuting volume may look impressive on a map, yet convert poorly if pedestrians are rushing past with no reason to stop for your concept.
Operators should separate total passersby from addressable demand. Addressable demand includes people whose timing, budget, trip purpose, and preferences align with your menu, price point, and service style. A foot traffic restaurant analysis that ignores those filters can overstate sales potential and understate labor and food-cost risk.
Commonly cited industry commentary often notes that a large share of new restaurants struggle within the first few years, though exact failure rates vary by source, market, and definition of failure. Treat any single percentage as a directional warning, then verify current benchmarks for your segment and metro before you underwrite a deal.
Pedestrian volume versus purchase intent
Pedestrian volume answers how many people are nearby. Purchase intent answers who is likely to enter, order, and return. Lunch corridors near offices can deliver strong midday tickets for fast-casual concepts while underperforming for destination dinner concepts after 6 p.m.
Map traffic by daypart: breakfast, lunch, afternoon snack, dinner, and late night. Then match those patterns to your kitchen capacity, staffing model, and expected check average so traffic supports culinary yield instead of idle prep.
Capture rate as the bridge to sales
Capture rate is the share of qualifying passersby you expect to convert into guests. It is rarely fixed. Visibility, access, wait times, signage, weather exposure, and competitive density all move the rate. Build low, base, and high capture scenarios rather than a single optimistic number.
How to Measure Foot Traffic Before You Commit to a Lease
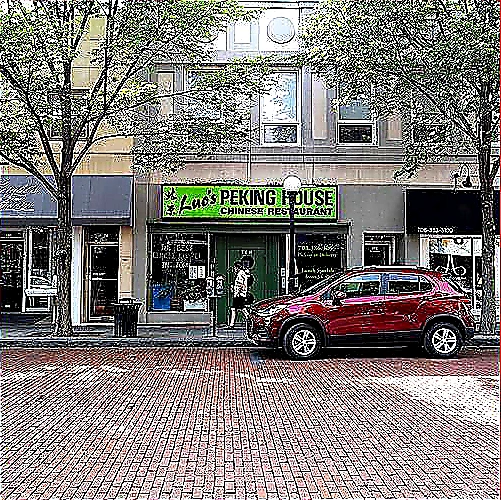
Start with primary observation. Count pedestrians during multiple days and dayparts that match your operating plan, including weekends if your concept depends on leisure trips. Note direction of travel, group size, bags or briefcases, age mix when observable, and whether people pause near storefronts or move straight through.
Layer secondary data next. Mobile location analytics, landlord traffic studies, transit ridership reports, and nearby employer or campus schedules can fill gaps, but each source has blind spots. Validate vendor outputs against your own counts before you treat them as underwriting inputs.
Document seasonality and weather effects. Tourism corridors, stadium districts, and school-adjacent streets can swing sharply by month. A foot traffic restaurant forecast that uses only a peak week will inflate annual sales and distort labor scheduling assumptions.
Trade-area rings and real walking behavior
Conventional drive-time rings are useful, but walk-up concepts need pedestrian isochrones: five-, ten-, and fifteen-minute walks shaped by sidewalks, crossings, hills, and barriers such as highways or waterways. People rarely walk in perfect circles, so redraw your trade area around actual paths.
Inside that walk shed, inventory generators: offices, residences, hotels, schools, medical campuses, entertainment venues, and transit stops. Rank each by how closely it matches your guest profile and visit frequency.
Competitive density and visibility checks
High foot traffic often attracts competitors. Count direct and indirect substitutes within the same pedestrian path, then estimate how demand may split. Strong visibility from the primary approach path, clear ingress, and readable daypart signage can matter more than being on the busiest block if guests cannot see or reach you easily.
Connecting Foot Traffic to Unit Economics and Prime Cost
Traffic only creates value when it supports a sustainable sales curve. Translate expected covers into revenue by daypart, then stress-test food cost, labor, occupancy, and contribution margin. If peak traffic arrives in a narrow window, you may need more prep capacity and front-of-house coverage for a short rush, which can pressure labor percentage even when weekly sales look healthy.
Prime cost discipline starts with realistic throughput. Overstated foot traffic leads to oversized kitchens, excess staffing, and higher break-even thresholds. Understated traffic can leave money on the table through too few seats, weak storage, or underbuilt production lines that create long waits and lost capture.
Culinary yield also links to traffic patterns. High lunch turnover concepts need prep systems that protect portion consistency under speed pressure. Destination dinner concepts may lean on higher check averages and slower turns, so evening pedestrian quality and reservation demand matter more than raw midday counts.
Build a traffic-backed sales model
Use a simple chain: qualifying pedestrians × capture rate × average check × operating days. Run sensitivity on each variable. If a modest drop in capture rate pushes contribution below your brand hurdle, the site is fragile even if the sidewalk looks busy.
Align the model with market research on local incomes, workplace density, tourism mix, and nearby residential growth. Confirm assumptions with current local data rather than national averages that may not fit your trade area.
Concept Fit, Dayparts, and Location Strategy Choices
Not every concept thrives on the same traffic profile. Counter-service and grab-and-go brands often need dense, recurring pedestrian flows with short dwell times. Full-service restaurants may prefer evening destination traffic supported by parking, rideshare access, and complementary nightlife or entertainment. Ghost kitchens and delivery-led formats care more about delivery radius density than sidewalk counts, though curb visibility can still help brand discovery.
Multi-unit brands should codify traffic thresholds by prototype. Define minimum qualifying pedestrian bands for urban inline, suburban lifestyle center, and freestanding pads. Then require analysts to document daypart mix, generator quality, and competitive set before a site advances to LOI.
Concept development and site selection must stay in conversation. If your menu is built for leisurely dinners, forcing the brand into a transit rush corridor can create operational friction and brand dilution. If your edge is speed and value, a quiet boutique street may never deliver the cover volume your prime-cost model needs.
When high traffic is the wrong signal
Tourist corridors can produce strong weekend volume with weak weekday baselines, complicating staffing and inventory. Office-heavy districts may collapse on remote-work Fridays or holidays. Always ask whether the traffic pattern matches your labor model and perishable purchasing cycle.
Also watch lease structure. Percentage rent in ultra-high-traffic centers can erode margins if sales rise without enough contribution after occupancy. Model occupancy cost against traffic scenarios before celebrating a prime address.
A Practical Workflow for Site-Selection Analysts
Create a repeatable scorecard. Weight pedestrian volume, daypart alignment, generator quality, visibility, access, competition, parking or transit, and lease economics. Require field notes with timestamps and photos so desktop analytics never stand alone.
Compare shortlisted sites with identical methods. Side-by-side scorecards reveal whether a "hot" location is truly stronger or simply better marketed by a broker. Include a no-go option; walking away is often the highest-ROI decision when traffic quality cannot support the concept.
After opening, keep measuring. Compare forecasted versus actual covers by daypart, then refine capture-rate assumptions for the next deal. Operators who close the loop between pre-opening foot traffic restaurant forecasts and post-opening POS data build a durable site-selection advantage across markets.
Questions to ask landlords and brokers
Request daypart traffic studies, tenant sales ranges when available, construction or streetscape plans that could disrupt access, and nearby lease expirations that may change the competitive set. Ask how traffic was counted and over what period so you can judge reliability.
Verify claims independently. Landlord decks are marketing tools. Your underwriting should rest on observed behavior, validated analytics, and a conservative sales case that still clears your return hurdles.
Frequently Asked Questions
What is a good foot traffic level for a restaurant?
There is no universal number that works for every concept. A strong target depends on your average check, seat count, daypart mix, and expected capture rate. Define qualifying pedestrians for your prototype, then reverse-engineer the volume needed to hit your sales and prime-cost goals using current local assumptions.
How can I measure foot traffic for a restaurant location?
Combine timed manual counts across multiple days and dayparts with secondary sources such as mobile location data, transit stats, and landlord studies. Always validate third-party estimates against on-site observation. Record weather, events, and seasonality so you do not underwrite peak conditions as normal.
Does high foot traffic guarantee restaurant success?
No. High volume without concept fit, visibility, easy access, and the right dayparts often produces weak conversion. Success depends on whether enough of those pedestrians become paying guests at a margin that covers food, labor, occupancy, and return requirements.
How does foot traffic affect restaurant labor and food cost planning?
Traffic patterns drive covers, which drive prep volume, staffing curves, and waste risk. Spiky lunch rushes can raise labor percentage if you must staff for a short peak, while slow evenings can leave perishable product unused. Build schedules and prep guides from daypart traffic, not weekly averages alone.
Should multi-unit brands use the same foot traffic standards in every market?
Use a shared framework, but calibrate thresholds by prototype and market. Urban walk-up standards rarely transfer cleanly to suburban centers with parking-led demand. Keep the scoring method consistent, then adjust minimums based on local wages, rents, check averages, and competitive density.
Conclusion
Foot traffic becomes a strategic asset when you treat it as qualified demand, not a vanity metric. Measure who is walking by, when they appear, and how well they match your concept, then connect those insights to sales scenarios, prime cost, and culinary throughput before you lease.
For Restaurant Site Finder Guides readers, the next step is straightforward: build a traffic scorecard for your prototype, validate counts in the field, and pressure-test every site against a conservative capture-rate case. That discipline turns sidewalk energy into clearer location decisions and stronger multi-unit growth.
Want a deeper dive on this topic? Read more about foot traffic restaurant.
Related Guides
- Restaurant Feasibility Study
- Multi Location Restaurant Analytics
- Restaurant Failure Rate Statistics 2024 2025


Comments
Post a Comment