Failure Rate Restaurants: What Operators Must Know
Failure Rate Restaurants: A Practical Guide for Operators
Bright colorful hero photo of a bustling modern restaurant dining room with warm wood tones, vivid neon menu accents, and sharp natural window light
Restaurant owners hear about failure rate restaurants long before they open their first door. The phrase is often used to scare founders or sell consulting, yet the real lesson is simpler: restaurants fail when demand, cost structure, and execution fall out of alignment-and most of those risks can be measured before you sign a lease. For more background, see Learn more about failure rate restaurants.
For multi-unit brands and site-selection analysts, failure rate is not a single industry number. It is a pattern of closings driven by weak trade areas, unsustainable prime cost, thin culinary yield, and concepts that never found a clear guest. This guide breaks those drivers into practical checks you can apply to new sites and existing units.
Use commonly cited industry ranges as starting points, then verify with current local data, landlord comps, and your own P&Ls. The goal is not to memorize a headline statistic-it is to build a location and operating plan that keeps you on the right side of the risk curve.
What Failure Rate Restaurants Really Measure
When people discuss failure rate restaurants, they usually mean the share of concepts that close within a set window-often the first one to five years. Those figures vary by source, market cycle, and how "failure" is defined. A sale, rebrand, or pivot can look like a closure in one dataset and a success in another. Treat published rates as directional context, not a forecast for your specific deal.
Commonly cited industry commentary often places early-year closure risk in a wide band-frequently discussed in the 20-60% range depending on segment, capital strength, and time horizon. That spread is exactly why operators should stop asking "What is the national failure rate?" and start asking "Which failure modes are most likely in this trade area for this concept?"
From an operator's view, failure is usually a cash-flow event: the unit cannot cover rent, labor, food cost, debt service, and a reasonable return. Understanding that definition helps you build early-warning metrics-weekly sales vs. break-even, labor hours vs. covers, and contribution after occupancy-rather than waiting for year-end statements.
Why national averages mislead site decisions
A national failure rate blends QSR, fast casual, fine dining, independents, and chains across strong and weak corridors. Your risk lives in a few blocks: daytime population, competitive density, access and visibility, parking or delivery economics, and rent as a percent of realistic sales. Two sites in the same MSA can have opposite outcomes.
Site-selection analysts should replace "average failure" with scenario modeling: base, downside, and stretch sales by daypart; rent and CAM sensitivity; and labor availability for the dayparts you need. If the downside case cannot clear occupancy and prime cost targets, the deal is already in high-risk territory.
Independents vs. multi-unit brands
Independents often fail from undercapitalization, weak supplier terms, and limited marketing reach. Multi-unit brands more often fail from overexpansion into soft trade areas, franchisee underperformance, or prototype drift that raises build cost without raising guest preference. Both groups share one vulnerability: opening a concept the market did not ask for at a rent the sales cannot support.
Location Strategy and Trade Areas That Reduce Closure Risk
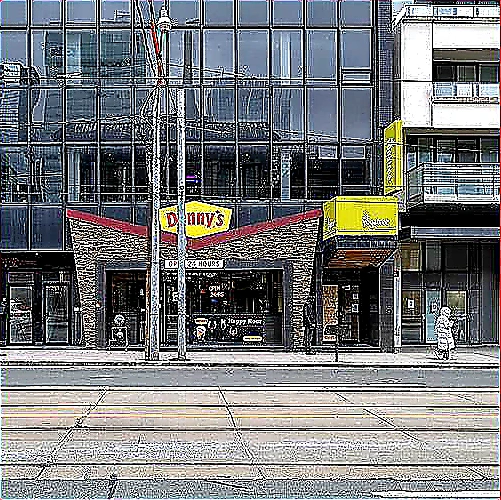
Location strategy is the highest-leverage lever against failure rate restaurants outcomes. A strong brand in a weak trade area still struggles; a clear concept in a well-matched corridor can absorb early operating mistakes. Start with guest geography: where do your core guests live, work, shop, and travel-and what is the realistic capture rate given competition and access?
Define the trade area with purpose, not radius alone. Drive-time rings matter for QSR and convenience dayparts; walkability and office density matter for lunch-led concepts; destination draw and parking matter for experiential dining. Overlay competitors by menu overlap and price tier, not just cuisine label. A "Mexican" competitor may be irrelevant if their ticket and occasion differ from yours.
Validate demand with more than demographic heat maps. Use mobile location insights where available, observed traffic counts, co-tenant strength, school and stadium calendars, and delivery platform heat if off-premise is material. Talk to neighboring operators about seasonal swings. Confirm that peak hours align with your labor model and kitchen capacity.
Prime rent and sales reality checks
A practical screen used by many operators is occupancy cost as a share of projected sales. Commonly cited healthy ranges often fall near the low-to-mid single digits for some QSR models and higher for full service-always verify against your segment benchmarks and current market rents. If you need heroic sales assumptions to make rent "work," you are modeling hope, not a site.
Build a break-even cover count by daypart. Translate that into guests per hour at peak and ask whether the dining room, kitchen line, and parking or pickup staging can physically deliver that volume without destroying ticket times and reviews.
Cannibalization and portfolio risk
For multi-unit brands, a new site can raise the portfolio failure rate even if it stays open-by draining an existing store below healthy contribution. Map overlapping trade areas, shared delivery zones, and brand search confusion. Approve sites on incremental system sales and contribution, not unit-level optimism alone.
Prime Cost, Culinary Yield, and Concept Fit
Even a good corner will not save a broken cost structure. Prime cost-typically food and beverage cost plus labor-is where many restaurants quietly fail. Commonly cited operating targets often place prime cost in a broad band around the 55-65% of sales range for many full-service models, with tighter expectations in high-volume limited-service formats. Treat those as conversation starters; set targets from your menu engineering, wage market, and service style.
Culinary yield connects the menu to the P&L. Over-portioning, poor trim specs, unused prep, and low-turn SKUs raise food cost without raising guest satisfaction. Engineer the menu around a focused set of proteins and prep processes, track theoretical vs. actual usage, and retire items that require unique prep with weak contribution. Yield discipline is as much a failure-prevention tool as a chef craft issue.
Concept development should precede site hunting. Clarify the occasion (weekday lunch, family dinner, late-night, catering), the ticket range, and the operational footprint. If your concept needs skilled cooks and 90-minute table turns, do not force it into a delivery-heavy corridor with high rent and thin labor. Mismatch between concept and site is a recurring theme in failure rate restaurants case studies shared across the industry.
Early-warning KPIs operators should watch weekly
Track sales vs. break-even, labor dollars and hours vs. sales, food cost variance, average check and mix, online rating velocity, and cash on hand relative to upcoming rent and tax payments. Weekly review beats monthly surprise. Assign an owner to each metric and a predefined action if thresholds trip-menu cut, hour reduction, marketing push, or landlord conversation.
Market Research and Analytics Before You Sign
Solid market research lowers the odds that you become another data point in failure rate restaurants discussions. Start with a written hypothesis: who the guest is, what occasion you win, and why this site beats alternatives. Then collect evidence for and against that hypothesis instead of only confirming it.
Compare at least three site options with the same scorecard: visibility and access, parking or transit, daytime and evening demand, competitive intensity, build-out cost, landlord terms, labor catchment, and delivery economics. Score qualitatively and attach dollar assumptions so the team debates numbers, not opinions. Include a kill criterion-conditions under which you walk away regardless of broker pressure.
Analytics should stay decision-sized. You do not need a 40-page deck; you need a one-page site memo with sales scenarios, rent sensitivity, capital need to cash-flow positive, and the top five risks with mitigations. For existing brands, require post-open audits at 30/90/180 days comparing forecast to actuals so the next site decision improves.
Capital, ramp, and contingency planning
Many closures are liquidity failures during a slow ramp. Commonly cited advice among operators is to reserve several months of operating expenses beyond build-out-exact needs vary by concept and market, so model your own runway. Include pre-opening training, soft opening discounts, and a marketing budget that does not assume free viral growth.
Negotiate lease structures that match ramp reality where possible: free rent during build-out, percentage rent components, or kick-out clauses tied to sales hurdles. Legal and brokerage support here is cheaper than a forced close.
How Restaurant Site Finder Guides approaches risk
Restaurant Site Finder Guides publishes practical frameworks for operators and analysts who need clearer site and concept decisions. Use failure-rate context to prioritize diligence-trade area fit, prime cost design, and honest sales modeling-then validate every assumption with current local data before you commit capital.
Frequently Asked Questions
What does failure rate restaurants mean for a new owner?
It refers to how often restaurants close within a defined period, often the early years after opening. The figure is not destiny for your unit. Focus on controllable drivers: site fit, rent vs. realistic sales, prime cost discipline, capitalization, and concept clarity.
Is there one official failure rate for restaurants in the United States?
No single official rate applies to every concept and market. Published and commonly cited ranges vary by methodology, segment, and time window. Use them as background risk context, then verify trends with current industry reports, local comps, and your own underwriting.
How does site selection affect restaurant failure risk?
Poor sites amplify every operating mistake because sales never reach the level needed to cover occupancy and labor. Strong trade-area fit, realistic capture assumptions, and rent that works in a downside case are among the most effective ways to reduce closure risk.
What prime cost range should operators target?
Many operators discuss prime cost targets in a broad mid-50s to mid-60s percent-of-sales band depending on service model, but your target must come from menu engineering, local wages, and throughput. Set a unit-specific target and review food and labor variance weekly.
Can multi-unit brands still fail if the concept is proven elsewhere?
Yes. Overexpansion, cannibalization, franchisee undercapitalization, and sites that do not match the prototype guest can produce closures even for established brands. Portfolio-level trade-area analysis and incremental contribution tests help prevent growth that looks good on a map but weak on a P&L.
What is the best next step before signing a lease?
Write a one-page underwriting memo with base and downside sales, occupancy cost, prime cost assumptions, capital runway, and kill criteria. Compare at least two alternate sites on the same scorecard and verify demand with current local data before you commit.
Conclusion
Failure rate restaurants headlines grab attention, but operators win by treating failure as a set of measurable risks-not a superstition. Align concept with trade area, underwrite rent against honest sales scenarios, and run prime cost and culinary yield with weekly discipline.
If you are evaluating a site or planning your next unit, build the memo, pressure-test the downside, and walk away when the numbers only work on hope. Restaurant Site Finder Guides is here to help you turn location strategy and market research into clearer, more resilient decisions.
Want a deeper dive on this topic? Read more about failure rate restaurants.
Related Guides
- Restaurant Failure Rate Statistics 2024 2025
- Restaurant Failure Rate Statistics
- What Is The Profit Margin For Restaurants


Comments
Post a Comment